SERENA VFB2 scientific observations on Nature
15 December 2022
The second Venus flyby of BepiColombo occurred in August 2021 was a great opportunity for the instruments onboard to explore one of the Solar System regions with a gas-dynamics dominated interaction between the supersonic solar wind and Venus itself.
The spacecraft passed through the full Venusian magnetosheath following the plasma streamlines (see Fig. 1, panel A), and crossed the subsolar stagnation region during very stable solar wind conditions. Such conditions were confirmed by the upstream measurements of the neighboring Solar Orbiter mission that performed a Venus flyby one day in advance.
The multipoint synergistic observations interested the following investigations: ions with MPPE/MIA, SERENA/MIPA and PAS (onboard Solar Orbiter), electrons with MPPE/MEA, energetic neutral atoms with MPPE/ENA, and the magnetic field components (of the IMF and the induced magnetosphere) with the MPO/MAG.
Fig. 1 (panel B) summarize the plasma region traversed, as identified from the measurements, with different colors for the different regions. In particular, it was well identified the ‘stagnation region’, a barely-explored subregion of the subsolar magnetosheath.
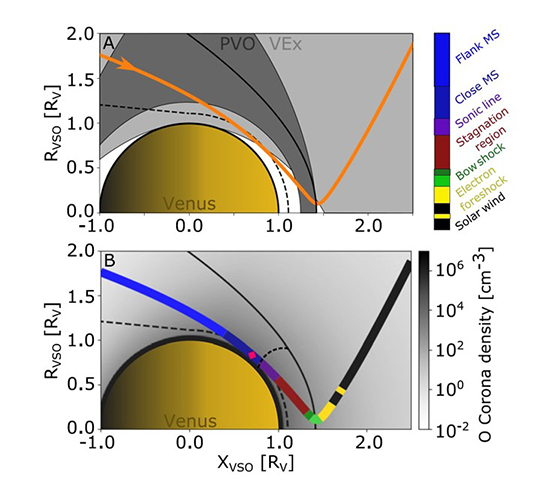
Fig. 1 The trajectory of BepiColombo 2nd Venus flyby in the cylindrical Venus-Solar-Orbital (VSO) coordinates. In VSO the x-axis points along the Venus-Sun line, the y-axis in the Venus anti-orbital direction and z-axis completes the orthogonal system.
Panel A: BepiColombo’s trajectory (orange) compared with the orbit coverage of the missions that have crossed the subsolar magnetosheath, VEx (light gray) and PVO (dark gray). The orange arrowhead indicates the trajectory direction.
Panel B: The trajectory of BepiColombo divided into different colors depending on the plasma region traversed, as identified from the measurements, Fig. 1 The trajectory of BepiColombo 2nd Venus flyby in the cylindrical Venus-Solar-Orbital (VSO) coordinates. In VSO the x-axis points along the Venus-Sun line, the y-axis in the Venus anti-orbital direction and z-axis completes the orthogonal system.
where the colorbar defines these regions. The red diamond shows the closest approach. The background gray colormap presents the expected oxygen corona density. The expected location of the sonic line is indicated by the smaller dashed line.
Bow shock and ion composition boundary are indicated by the curved and dashed black lines, respectively.
During the 2 hours of the flyby on August 10th, 2021, the trajectory of the spacecraft gave access to the interaction region, giving a complete and almost instantaneous picture of the different subregions of the magnetosheath:
• where the solar wind is heated and significantly decelerated,
• where it is deflected around Venus,
• and finally where it is accelerated up to almost solar wind speeds again along the flank.
A summary of the BepiColombo plasma measurements is shown in Fig. 2.
The sampling of the Venusian magnetosheath done provides us with detailed insight into the structure and properties of the gas-dynamic dominated interaction region between the solar wind and Venus, at near solar minimum for conditions of low solar wind pressure. Since the sampling was made during stable solar wind conditions, as measured by the upstream Solar Orbiter, we had the opportunity to investigate the pure spatial variations, without fluctuations typically induced by the temporal variations of the solar wind. The observations near the subsolar magnetosheath show a passage through the almost unexplored stagnation region, where the solar wind is significantly heated and slowed down.
This is confirmed by a comparison with the output from a global hybrid model (LatHyS35) by Aizawa et al.(2022) that confirmed that the model is well constrained, and by the upstream solar wind conditions measured by Solar Orbiter and that the validity of the model output is confirmed through the good match between its magnetic field components and the MPO-MAG measured magnetic field components.
All details can be read here: https://doi.org/10.1038/s41467-022-35061-3
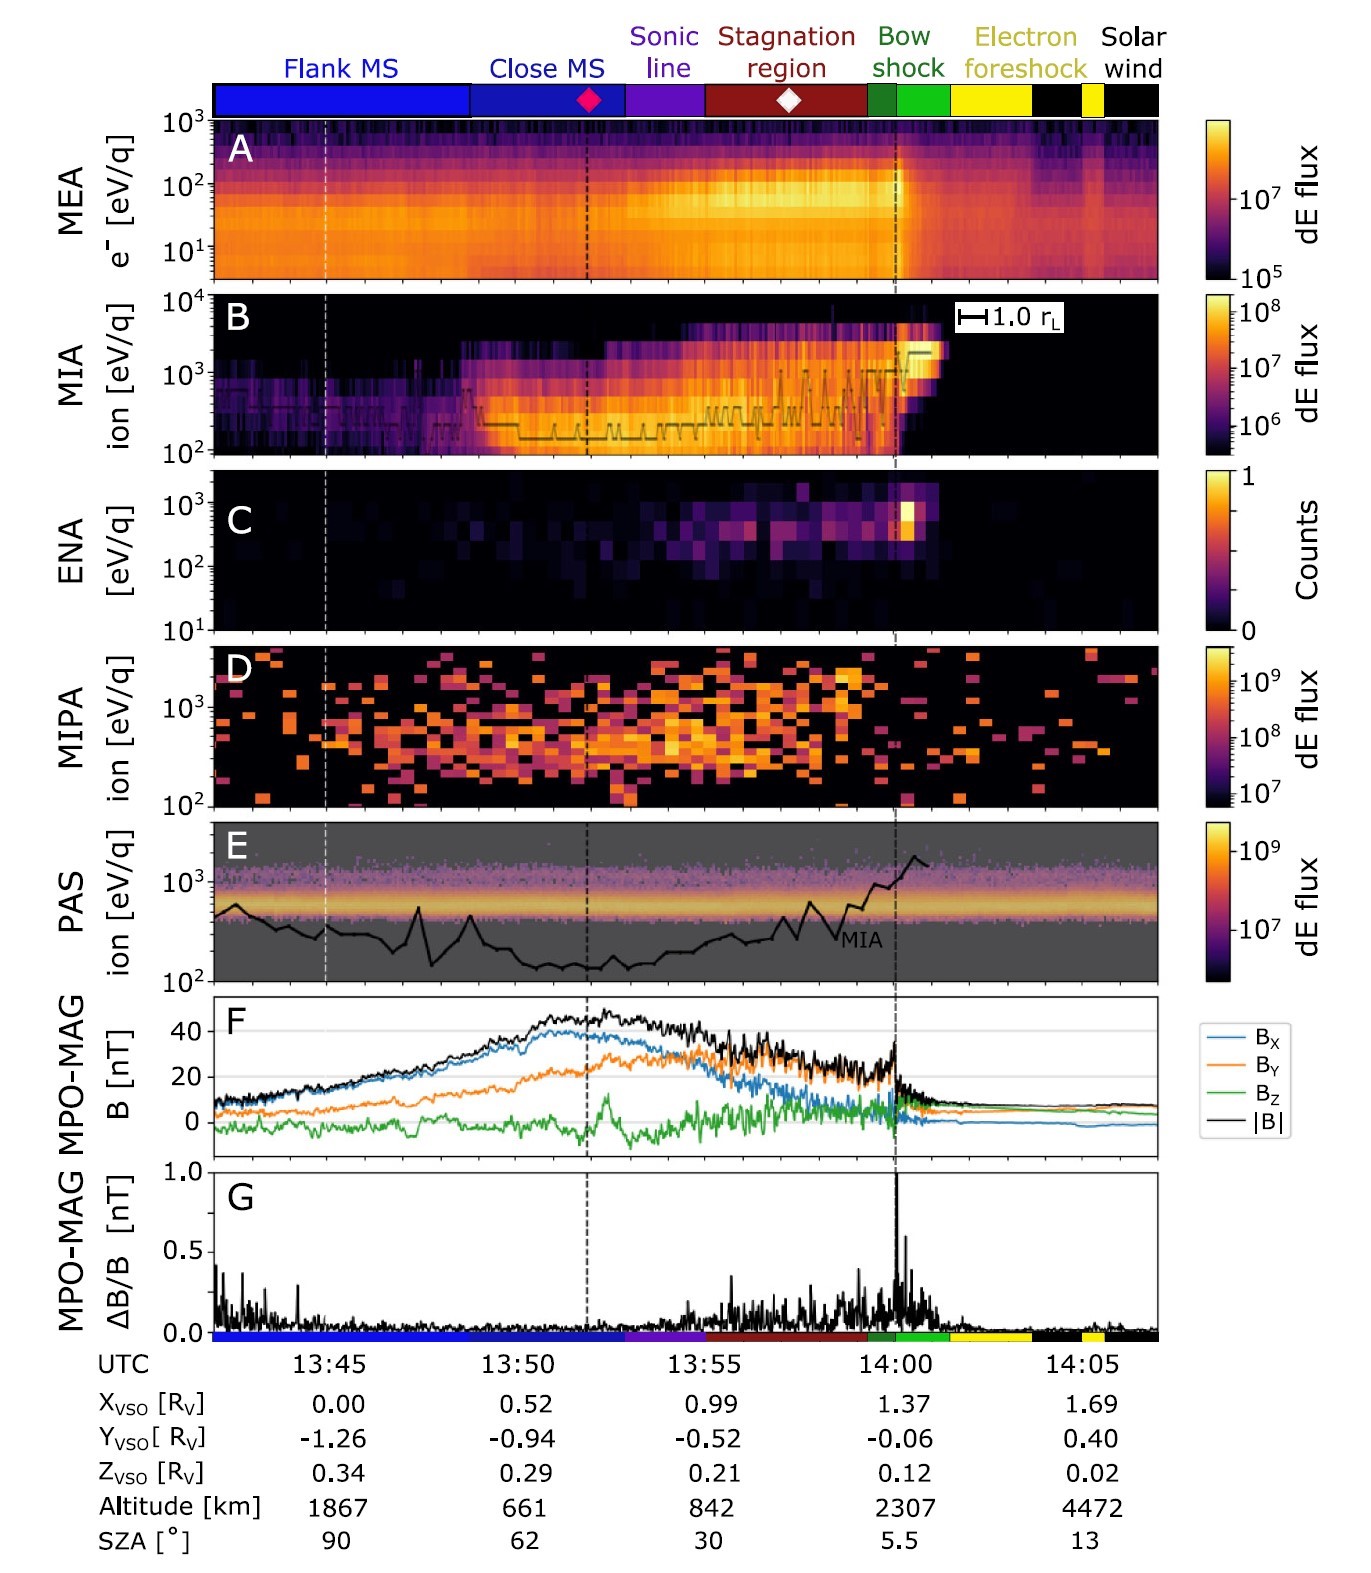
Fig.2 Electron, ion and magnetic field measurements made by the three spacecraft MPO, Mio, and Solar Orbiter during BepiColombo’s 2nd Venus flyby on August 10, 2021. Energy-time spectrogram of omni-directional (A) Mio/MPPE/MEA differential energy flux (dE flux) [cm−2 s−1 eV/eV]; (B) Mio/MPPE/MIA differential energy flux [cm−2 s−1 eV/eV] (with black line showing the peak energy bin), (C) Mio/MPPE/ENA normalized counts, which nominally measures energetic neutral atoms but heremeasures neutrals originating from protons neutralized by the interaction with the spacecraft structures and thus operates as a very sensitive monitor of proton fluxes, (D) MPO/SERENA/MIPA differential energy flux [cm−2 s−1
eV/eV], (E) Solar Orbiter/PAS differential energy flux [cm−2 s−1 eV/eV] (shifted by 1 h, and slightly shaded) with the peak energy bin from MIA (black line, smoothed for clarity) overplotted for comparison, (F) the magnetic field in VSO coordinates, and (G) the variations of the magnetic field measured by MPO/MAG.
All ion measurements are shown integrated over mass.
The terminator crossing is indicated by the vertical dashed white line, and the closest approach of
550 km altitude by the vertical black dashed line. The inset in B shows the approximate length of one gyroradius (rL) calculated from the solar wind conditions near the bow shock. The colorbar on top shows the regions identified from the changes in the plasma parameters measured by the different instruments. The bow shock is differentiated into two green shades for the ramp and ion foot (light green) and the over- and undershoot (dark green). The subsolar magnetosheath (MS) is differentiated into two subregions: the stagnation region (brown) and the sonic line (purple). The red diamond shows the closest approach. The
colors are also shown along the trajectory in Fig. 1B.